
I moved to America partly because I believed its promise of opportunity. Preserving that promise requires confronting the growing distance between working hard and getting ahead.

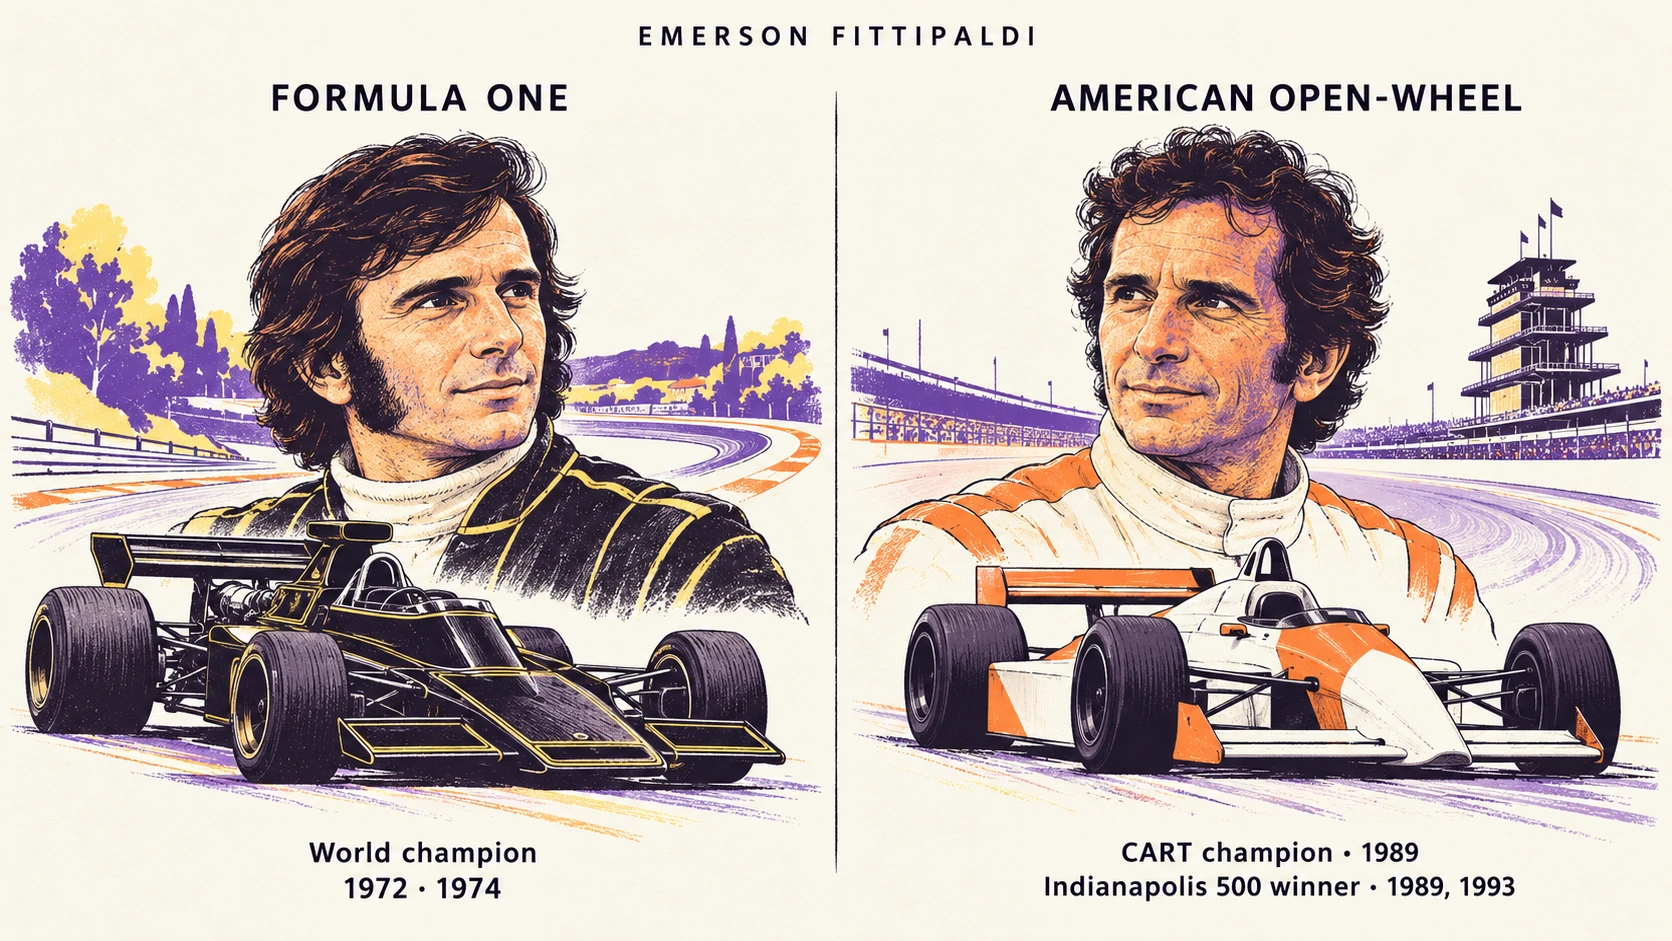
One of the things that motivated me to move to the United States was an interview with Emerson Fittipaldi.
Fittipaldi had won two Formula One world championships, in 1972 and 1974. He then built another extraordinary career in America, winning the 1989 CART championship and the Indianapolis 500 in 1989 and 1993. He had succeeded on both sides of the Atlantic.
In an interview I remember watching, a Brazilian reporter asked him about the biggest difference between the United States and Brazil.
As I remember his answer, an American looking at a wealthy person would think: I’m going to work hard, and one day I’ll be that rich. A Brazilian would suspect that the fortune had come from corruption.
What attracted me was the possibility of living somewhere that treated another person’s success as evidence of what I might accomplish.
I wanted to participate in that kind of society.
Today, I wonder how reliably America still delivers the opportunity that makes that optimism possible.
Today, the suspicion of wealth I see in America feels increasingly familiar from my time in Brazil. People question how fortunes are made and the political influence they purchase. They study, work, advance, and still struggle to feel secure.
What happens to a society built around aspiration when people lose confidence that hard work will get them ahead?
America has become much richer. Between 1980 and 2024, its inflation-adjusted economic output more than tripled, from about $7.3 trillion to $23.4 trillion. Output per person more than doubled.
That growth expanded what the country could afford: better housing, healthcare, education, retirement, and time outside work.
Turning that productive capacity into shared prosperity required a way to distribute its rewards.
The promise of shared prosperity
For decades, American policy placed extraordinary faith in investment incentives and market competition to make that connection.
Neoliberalism offered a promise: deregulate business, privatize public services, cut taxes on high incomes and capital, and give markets more room to operate. Investment would grow. Jobs would follow. Prosperity would spread. A rising tide would lift all boats.
Reagan made that promise central to his economic program. The shift crossed party lines: Carter deregulated airlines, and Clinton signed the Gramm–Leach–Bliley Act, dismantling major barriers between commercial banking, securities firms, and insurance companies.
The political appeal reached beyond the economy people lived in. It spoke to the people they hoped to become.
If you expected to own a successful business someday, restrictions on employers could feel like restrictions on your future. If you imagined accumulating a fortune, taxes on large fortunes could feel like a penalty waiting for you.
The prospect of becoming rich gives people a reason to defend rules whose greatest benefits go to those who already are.
The promise remains powerful even as the route to fulfilling it grows less dependable.
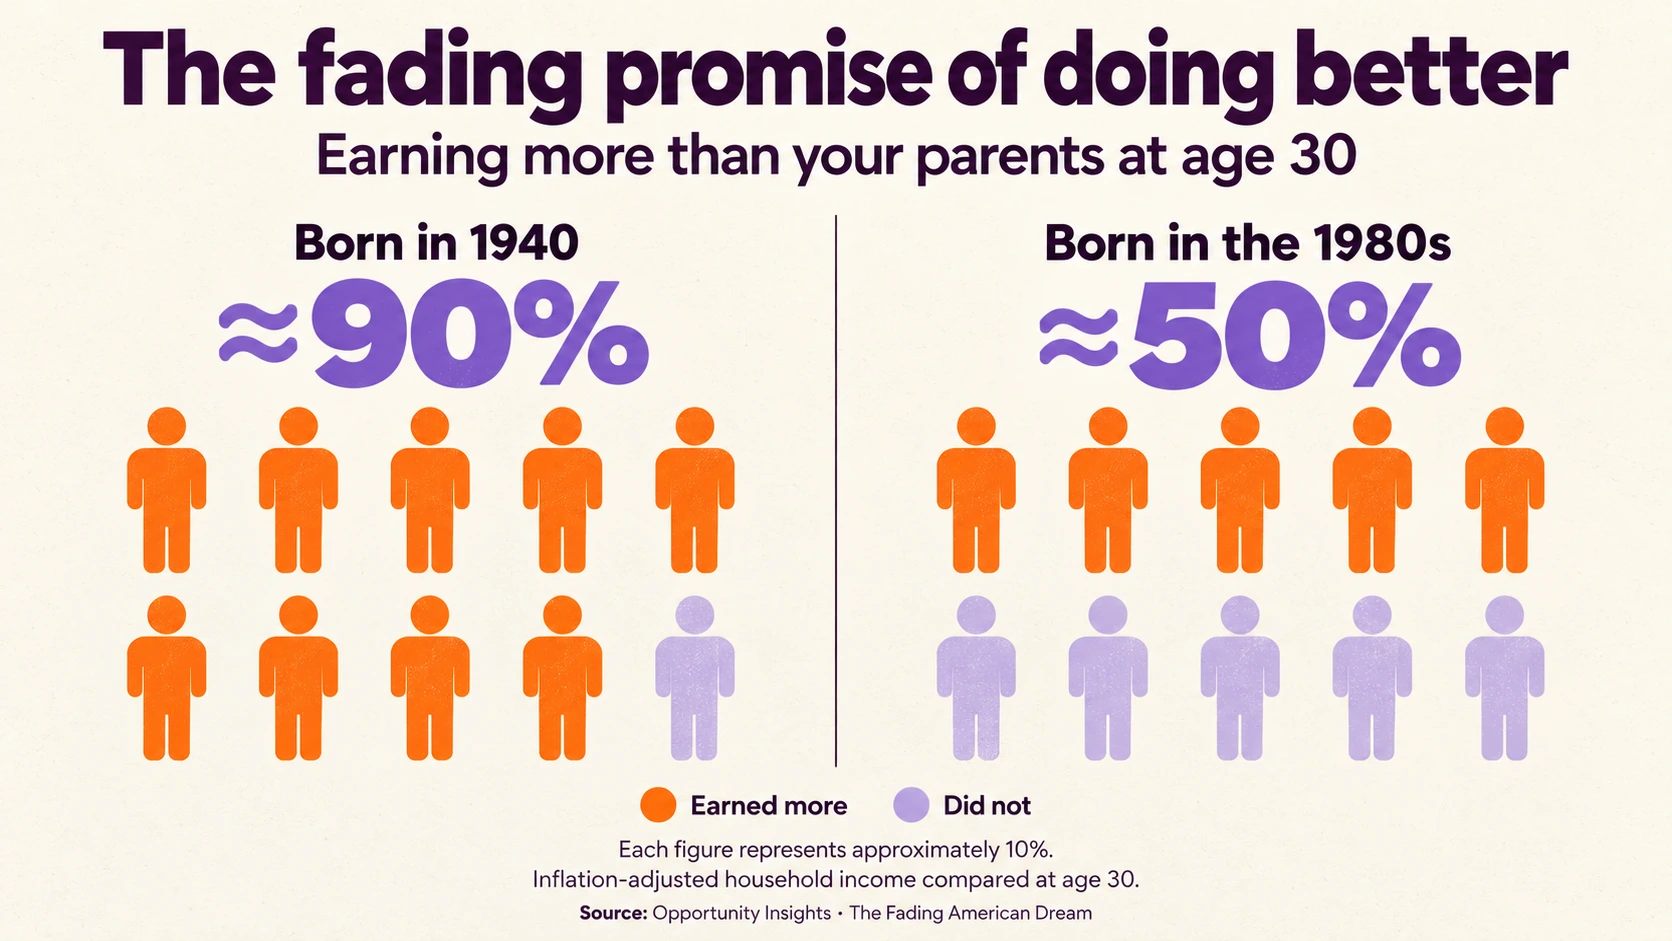
About 90% of Americans born in 1940 earned more than their parents at age 30, after adjusting for inflation. Among those born in the 1980s, that share fell to roughly half. What had felt like the normal course of life became something closer to a coin toss.
America also trails Nordic countries in loosening the connection between a child’s earnings and their parents’ circumstances. The country that celebrates upward mobility so enthusiastically has allowed family background to exert a stubborn hold on opportunity.
The dream survives. Its delivery has become less reliable.
The casino in your pocket
The casino economy is already visible in the rise of trading and sports-betting apps.
A casino needs winners. Their existence makes the possibility of winning visible to everyone else.
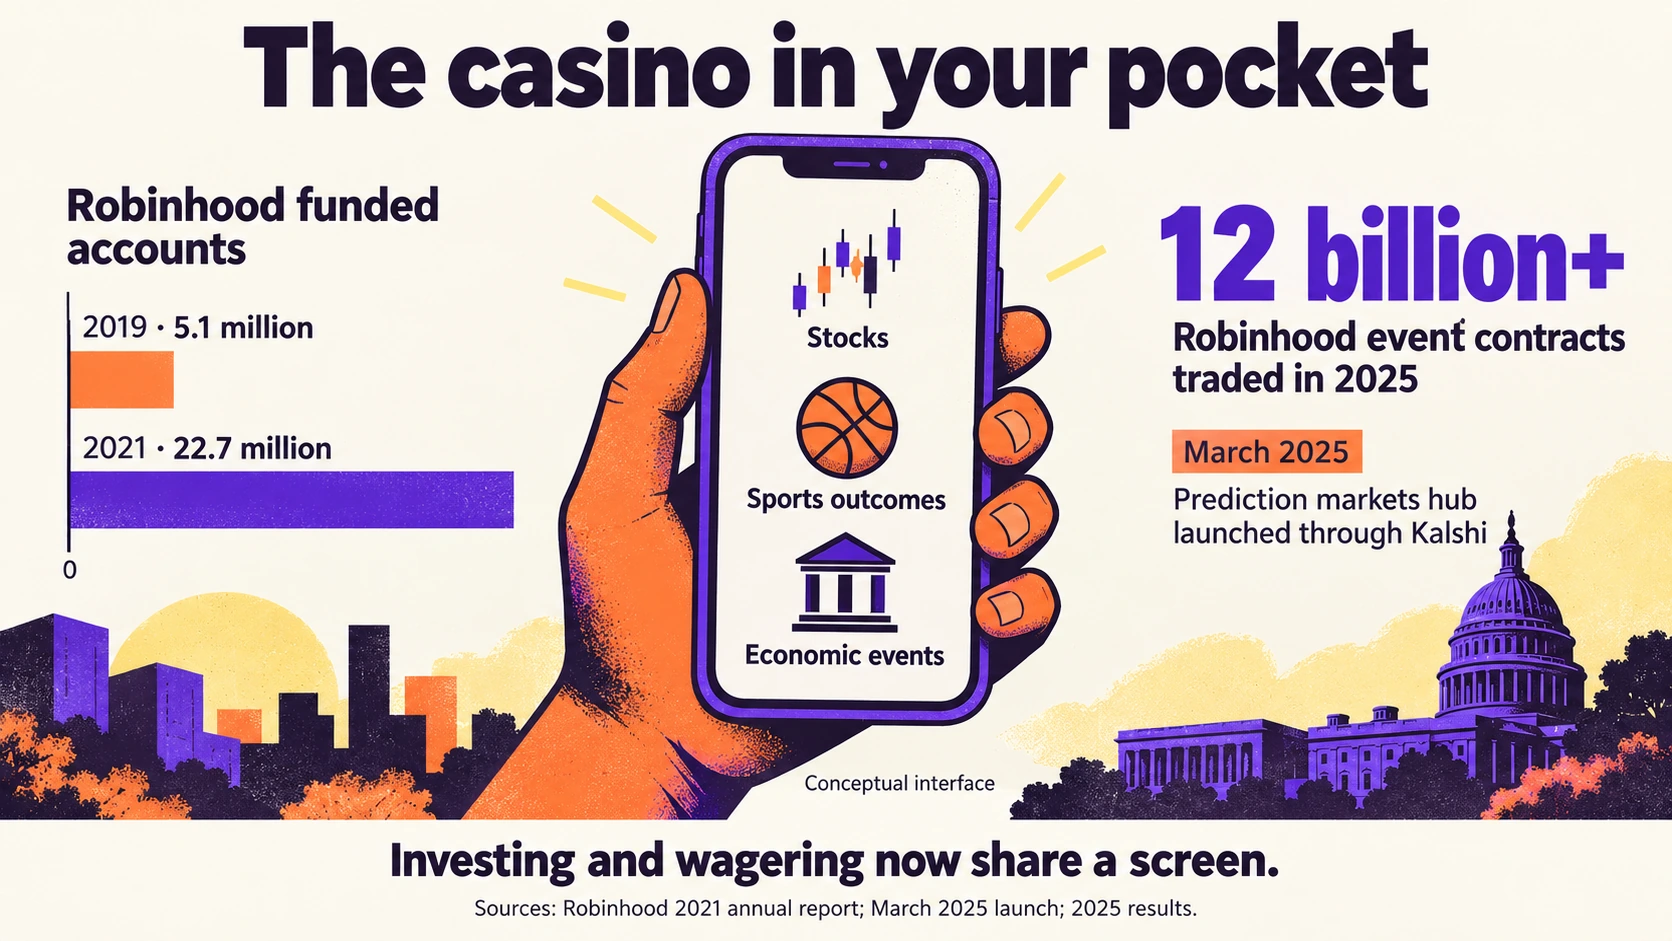
Robinhood and other trading apps put financial markets in people’s pockets. Robinhood’s funded accounts grew from 5.1 million at the end of 2019 to 22.7 million at the end of 2021. By 2024, 80% of investors under 35 with nonretirement investments reported using an app to trade. Speculation became something you could fit between messages.
Sports betting arrived on the same screen. Americans placed $149.9 billion in legal sports wagers in 2024, generating $13.78 billion in commercial sportsbook revenue. An enormous business had grown around the possibility that the next prediction would pay off.
The products themselves began to merge. In March 2025, Robinhood launched a prediction-markets hub through Kalshi’s exchange, offering contracts on college basketball tournaments alongside a Federal Reserve interest-rate decision. More than 12 billion event contracts traded through Robinhood that year. The investing app had become a place to wager on a game.
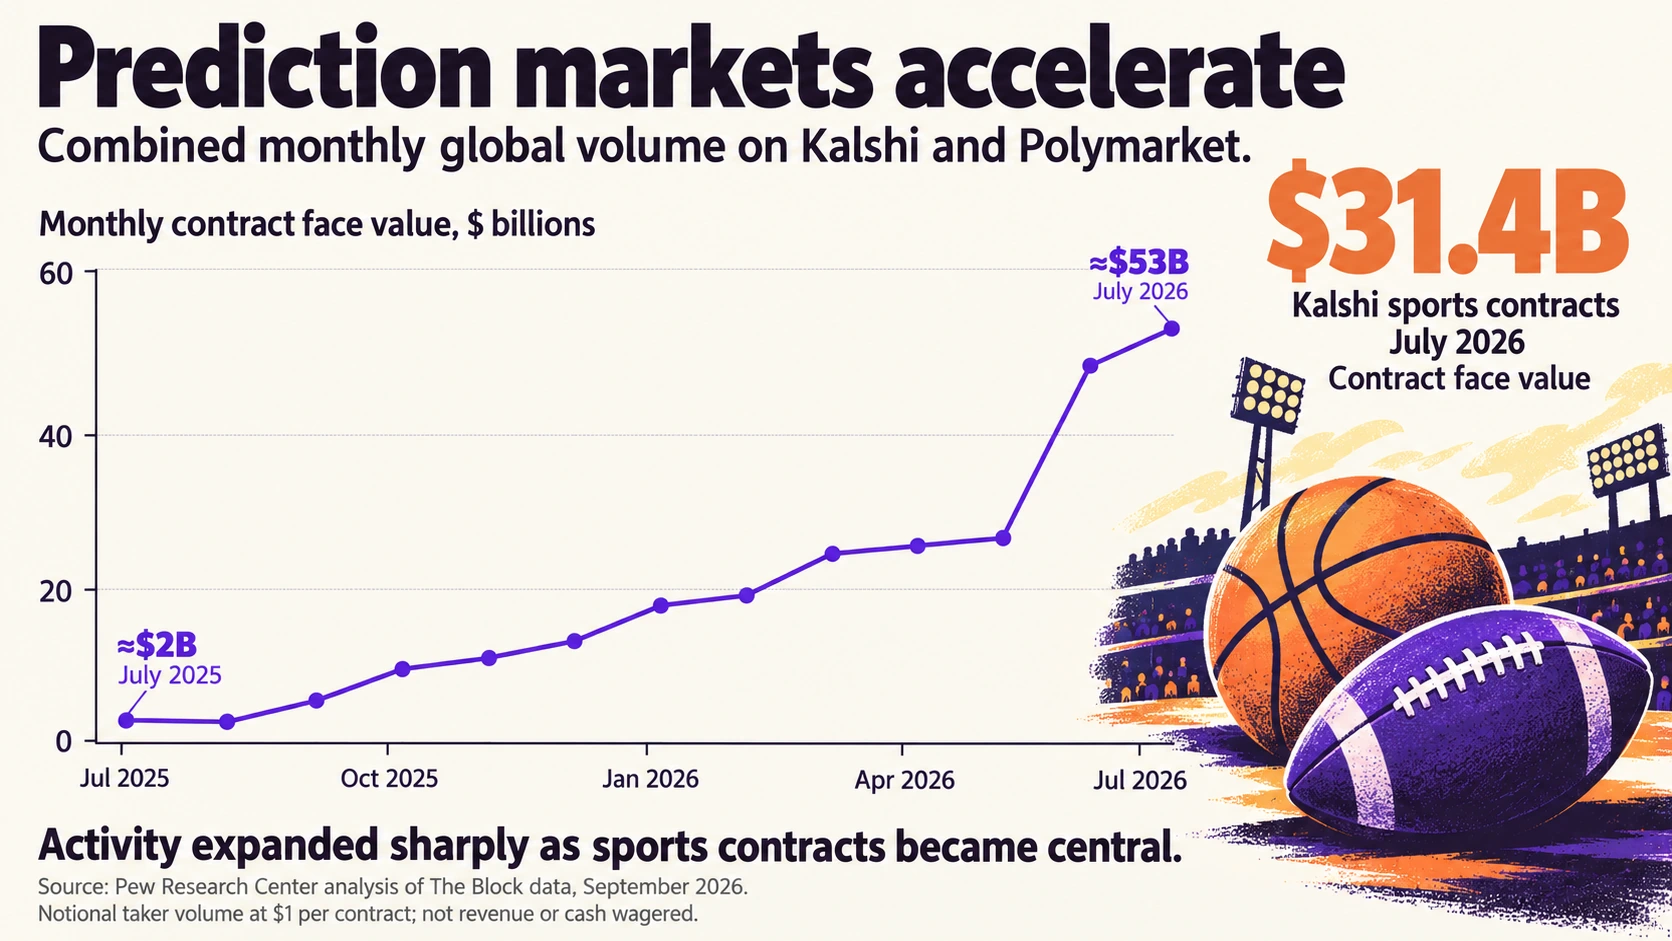
Kalshi and Polymarket show the scale of the transformation. Their combined monthly trading volume rose from about $2 billion in contract face value in July 2025 to $53 billion in July 2026. Sports contracts accounted for $31.4 billion on Kalshi alone that July. An expanding industry was making the wager part of everyday financial life.
I see day-trading, sports betting, and prediction markets as strong signs of a casino economy: a culture organized around the possibility of a windfall. When ordinary work feels like a treadmill, the promise of a sudden breakthrough becomes easier to sell. The casino economy turns that frustration into a market.
A society should offer a dependable route to prosperity. Increasingly, we are invited to chase an extraordinary payoff.
Waiting for the exit
I live in the Bay Area, where that invitation takes a familiar form. Entrepreneurs build companies. Employees count the months until their stock options vest. An acquisition or public offering promises to turn years of work into lasting independence. The people who make that leap are highly visible.
I know that promise firsthand. I sold my first startup in Brazil for hundreds of millions.
Success stories like mine tell everyone else what is possible. They say much less about what is probable.
In a 2011 Harvard Business School discussion, Shikhar Ghosh estimated that 70–80% of startups fell short of their projected investment returns. The spectacular exit celebrated across Silicon Valley is a precarious foundation for an employee’s financial future.
Building a company creates value when it solves a problem people will pay to have solved. The casino logic enters when a spectacular exit becomes the answer to the cost and insecurity of ordinary life. Years spent vesting become years spent waiting for the payout that will finally make everything feel secure.
A venture fund spreads its bets across companies. An employee may depend on one company for both a paycheck and a hoped-for fortune. When it fails, the job and the imagined safety net disappear together. The promise of becoming an owner makes it easier to accept insecurity while remaining dependent on an employer.
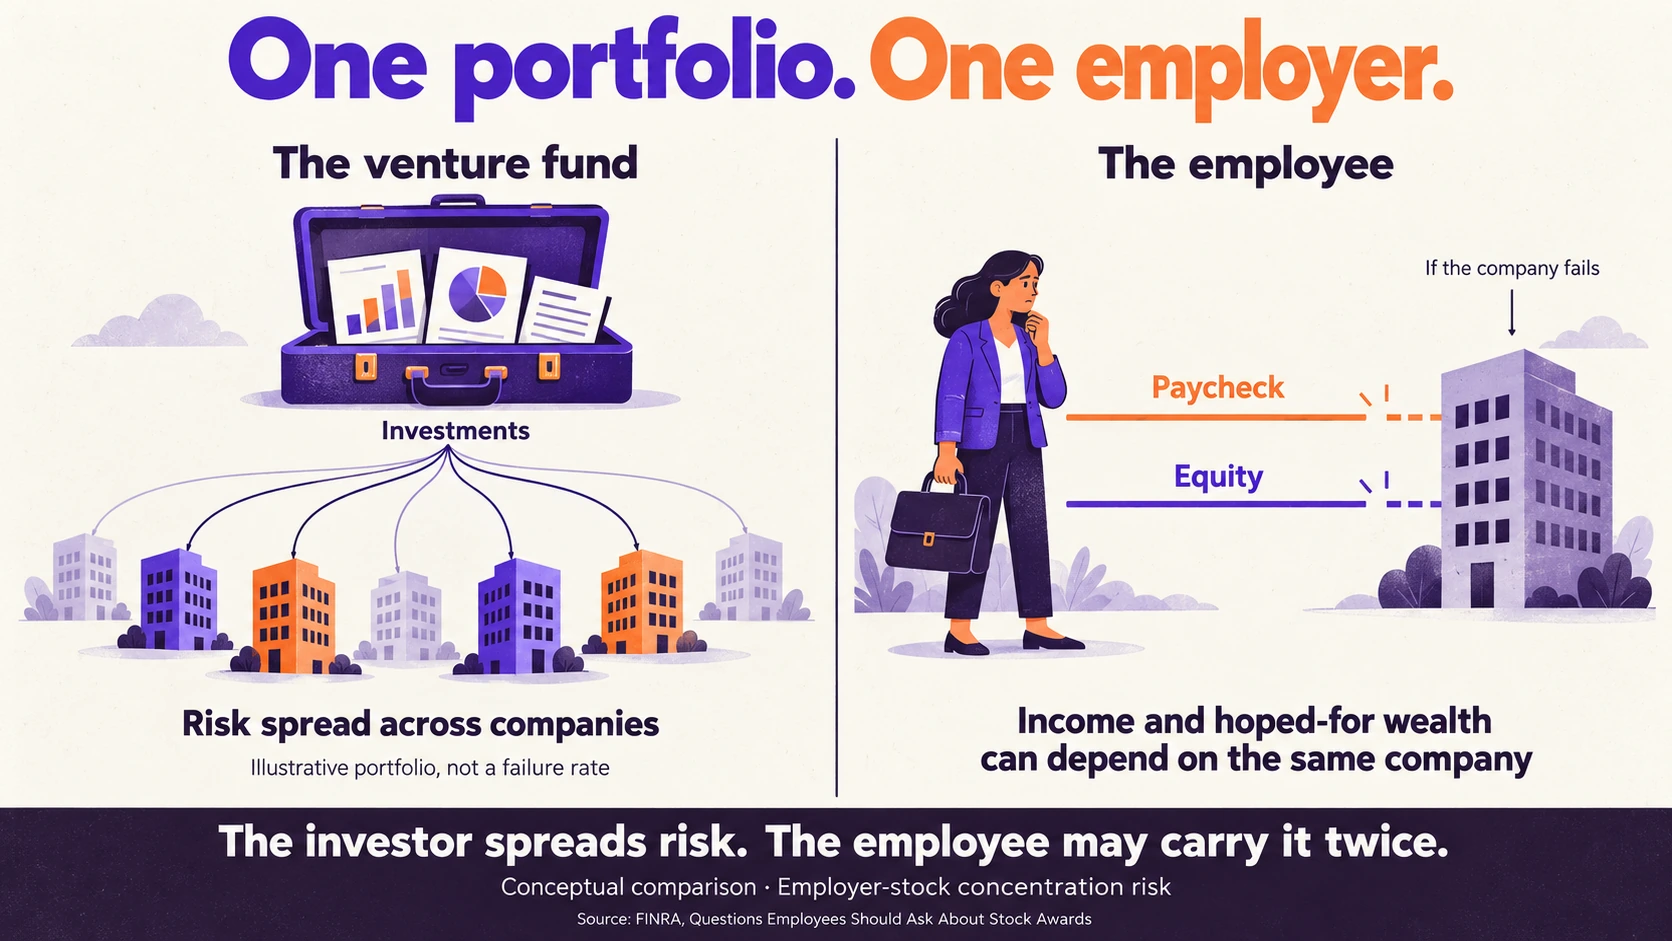
The winners keep the promise visible. Everyone else keeps working toward it.
The rat race
For much of the middle class, this is the rat race: another credential, another promotion, another salary increase, all pursued while housing, childcare, healthcare, and retirement absorb the gains.
Getting ahead becomes difficult to distinguish from avoiding a fall behind.
Half of American renter households, or 22.4 million, spent more than 30% of their income on rent and utilities in 2022.
In 2024, 37% of adults would have had to borrow, sell something, or go without to meet a $400 emergency. Thirteen percent could not cover it at all. In a country this rich, millions of people remain one modest expense away from trouble.
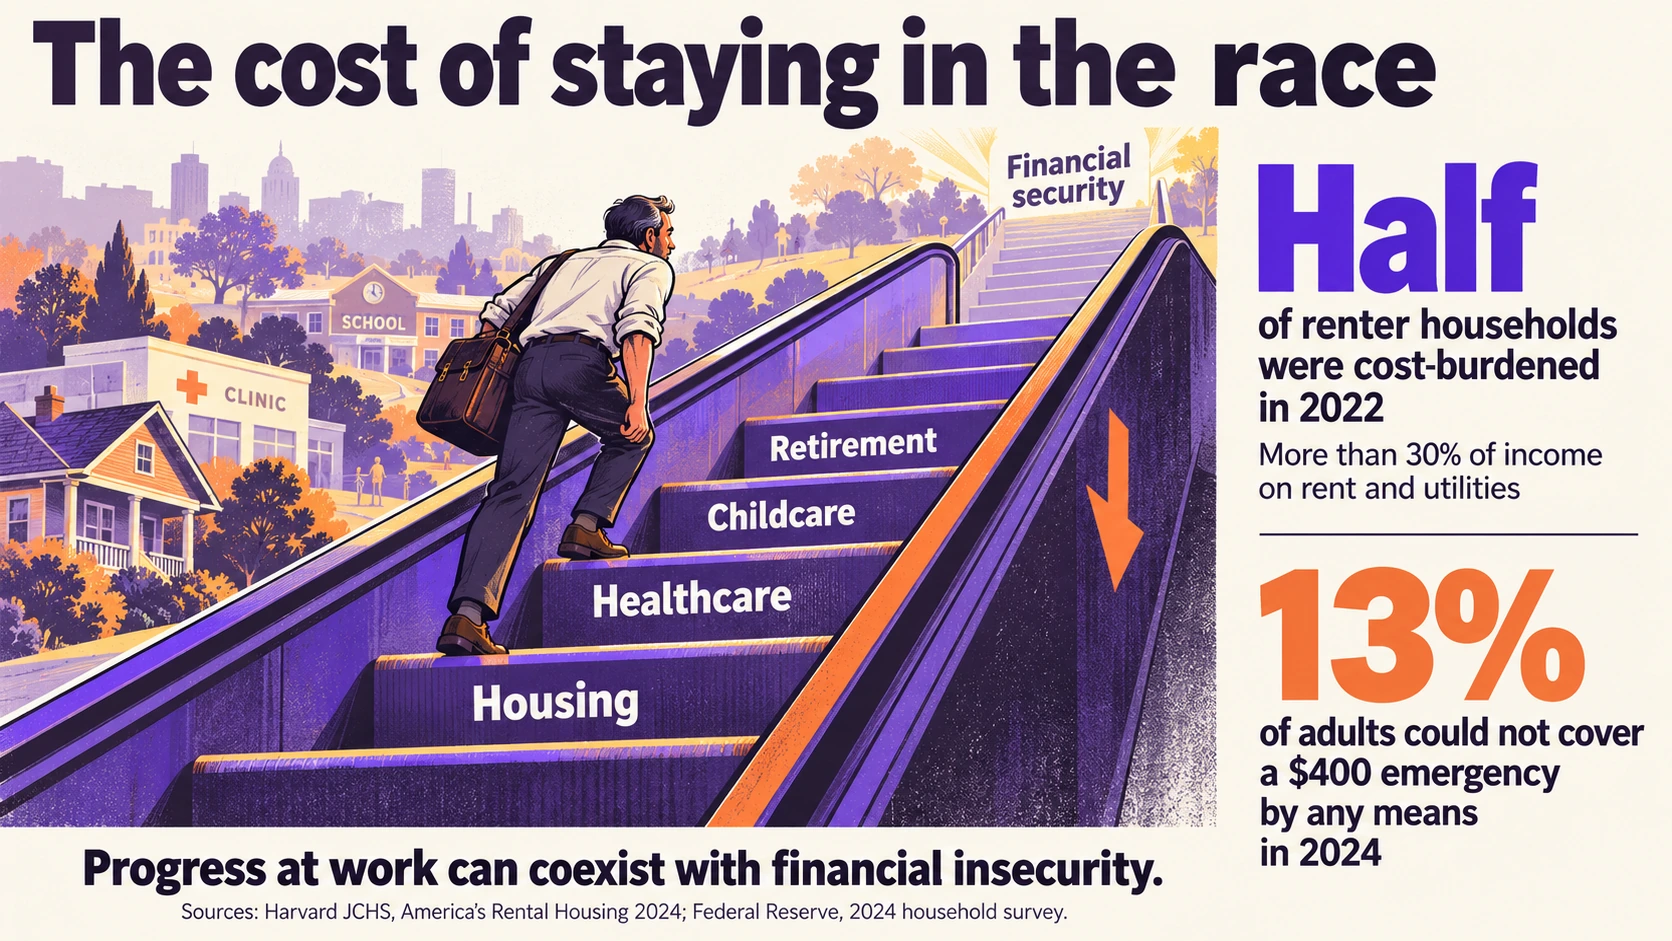
An economy should offer a decent life to people whose contribution is useful and ordinary. Financial security should be attainable without becoming an exceptional winner.
The distribution of income shows why growth alone has been insufficient.
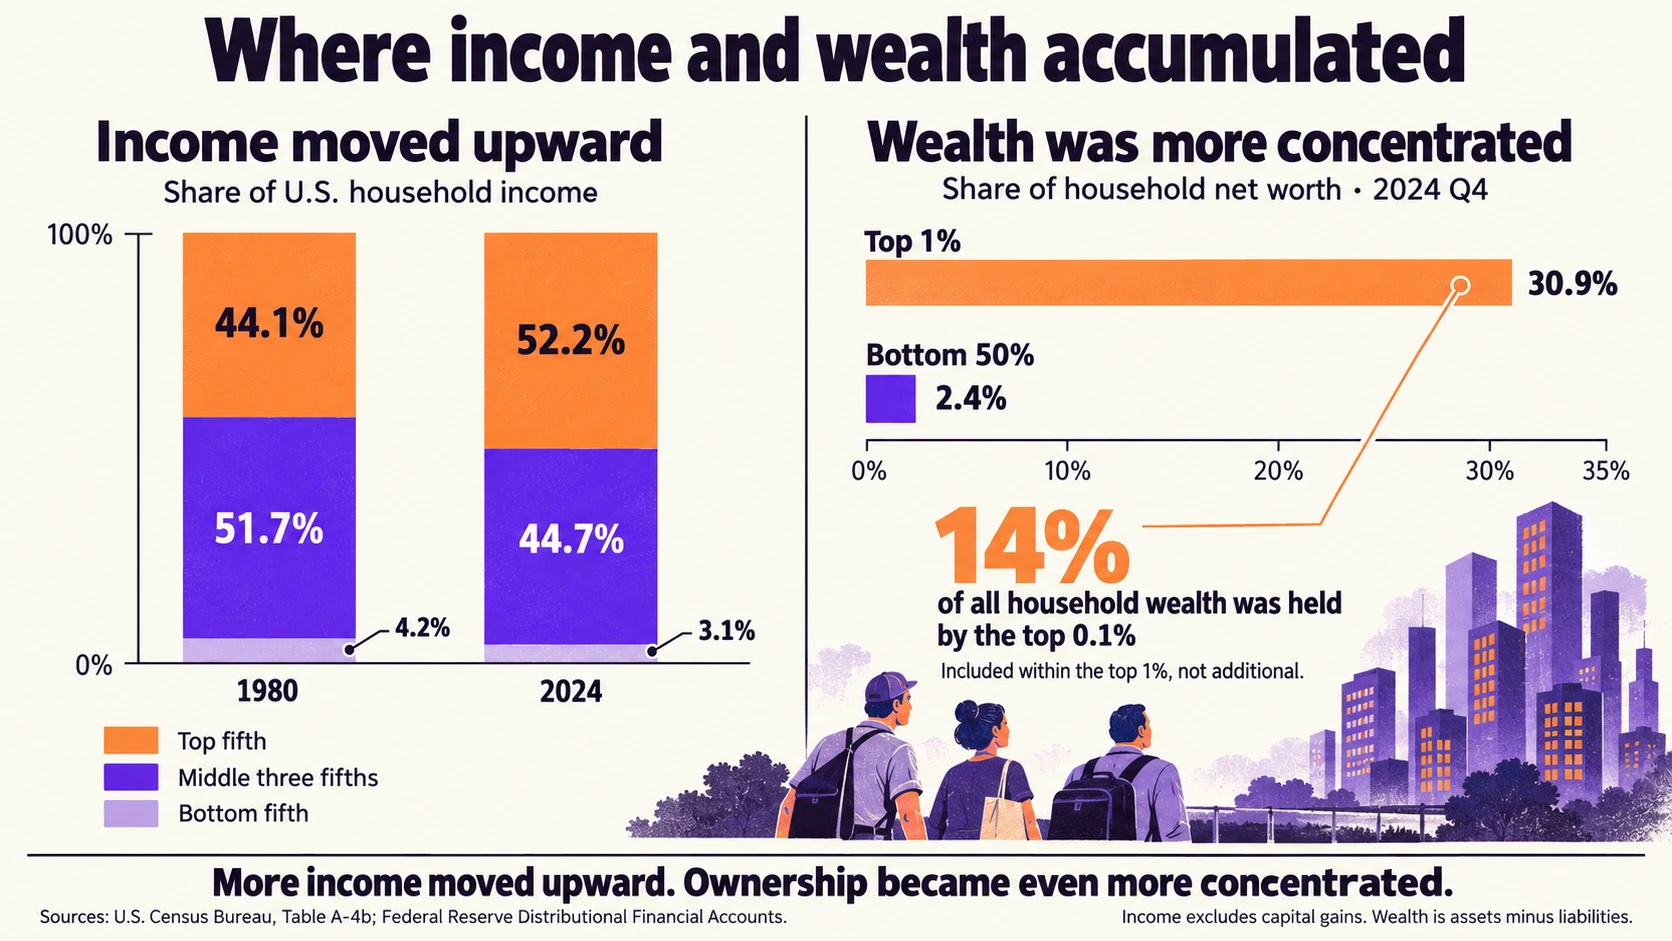
In 1980, the highest-income fifth of households received 44.1% of household income. By 2024, they received 52.2%. The middle three fifths’ combined share fell from 51.7% to 44.7%. More of the national income flowed upward.
Tax records reveal the concentration within the top. The highest-income 1% of tax returns received 22.4% of adjusted gross income in 2022, up from 17.4% in 2001. The top 0.1% alone received 11.4%, up from 8.1%.
Wealth followed the same direction. The wealthiest 1% owned 22.8% of household net worth in 1989 and 30.9% at the end of 2024. The bottom half’s share fell from 3.5% to 2.4%. The wealthiest 0.1% alone owned 14% by the end of 2024, nearly six times as much as the entire bottom half combined.
Ownership, and the security it provides, became more concentrated.
High income and lasting independence
That distinction matters to anyone trying to work their way into lasting independence.
A salary pays you while you remain employed. Wealth can keep paying you after you stop. That difference shapes how much control you have over your life.
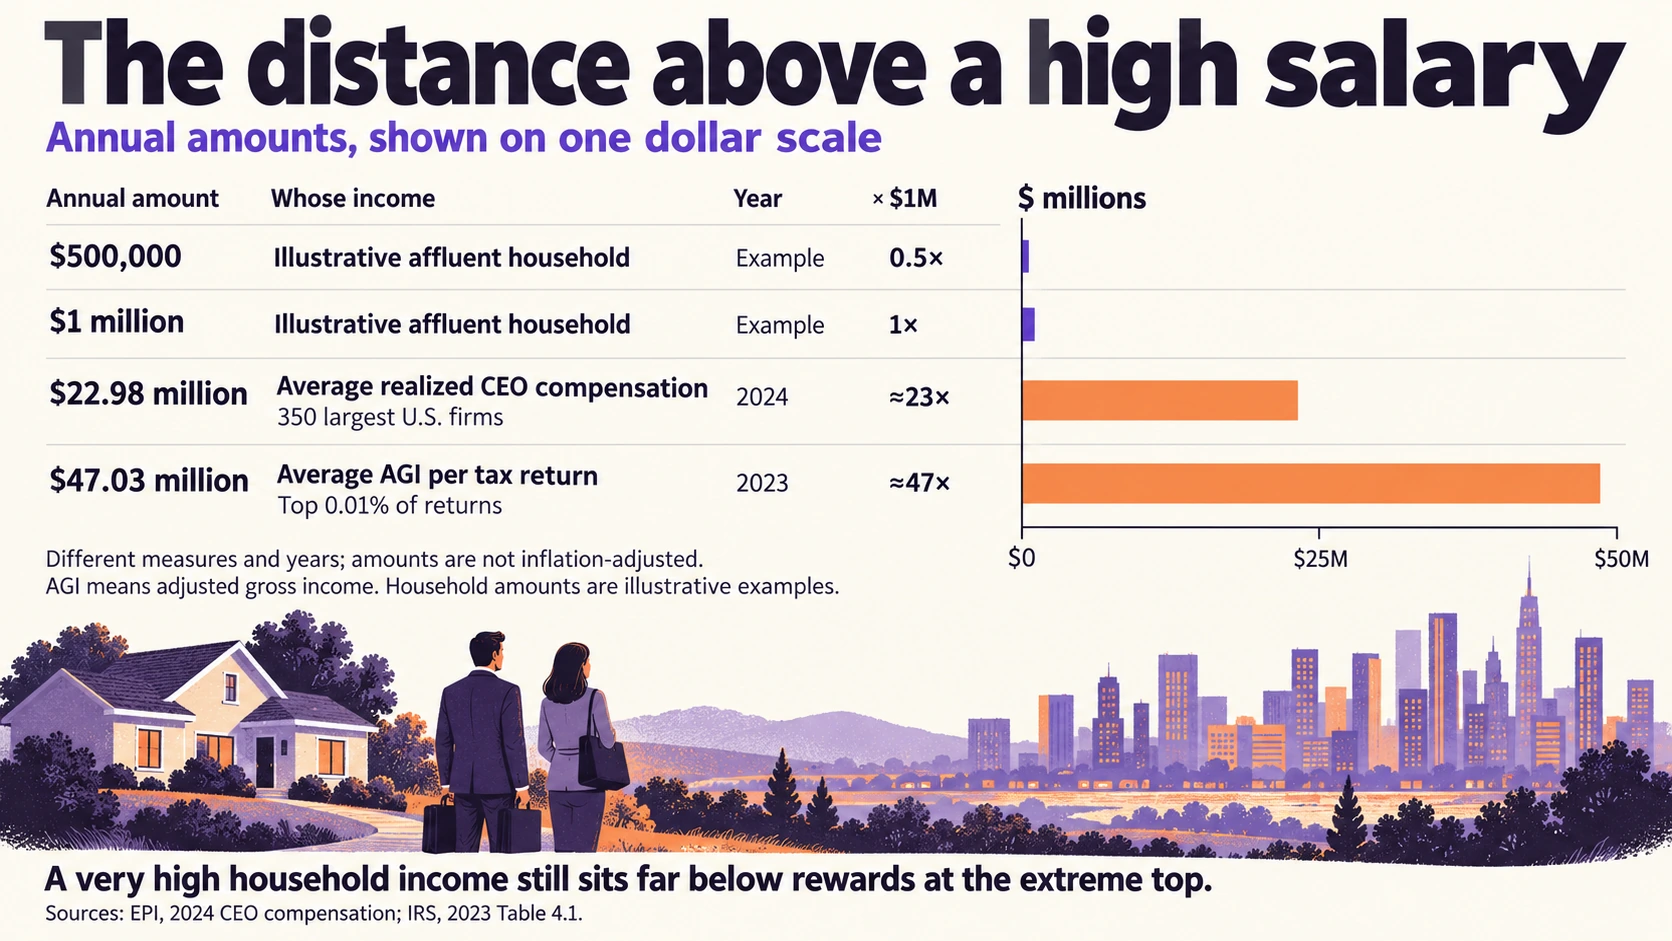
Consider a Bay Area household earning $500,000 to $1 million a year. These are successful people. They have purchasing power, savings capacity, and choices most Americans lack. They have done exceptionally well within the world of work.
For scale, average annualized wages in May 2025 were about $100,000 per worker in the San Francisco–Oakland–Fremont metro area and $119,000 in San Jose–Sunnyvale–Santa Clara. Our affluent household brings in roughly four to ten times those individual wages.
Some of these households already belong to the top 1% by income: the threshold was about $676,000 in adjusted gross income per tax return in 2023. But look farther up. The top 0.01% averaged about $47 million that year, roughly 47 to 94 times what our affluent household earns.
At the 350 largest U.S. firms, CEOs received average realized compensation of about $23 million in 2024. One executive received roughly 23 times a million-dollar household’s income, or 46 times a $500,000 household’s income.
A million-dollar household sits much closer in annual dollars to a household earning $50,000 than to an executive receiving $23 million. The deeper connection is dependence on work. An expensive home and a prestigious title do not make an employer’s paycheck optional. Sufficient wealth does.
Who gets the rewards
Bargaining power helps determine how much workers can earn, save, and eventually own.
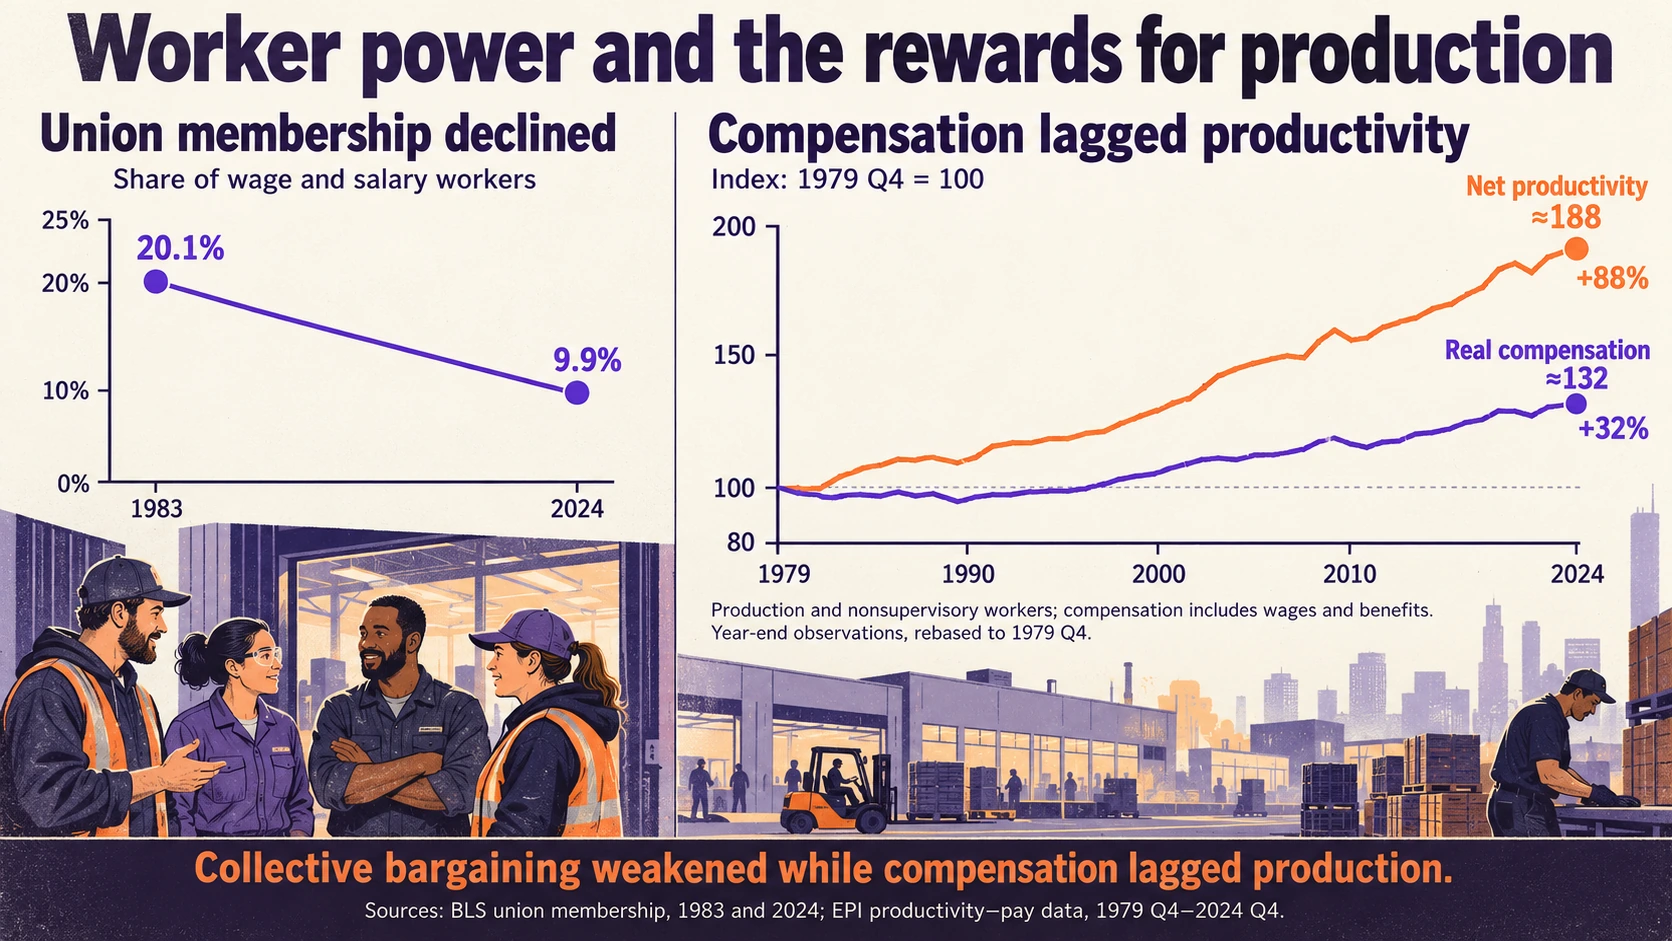
Union membership fell from 20.1% of wage and salary workers in 1983 to 9.9% in 2024. The share of workers with that collective voice was cut in half.
The Wagner Act established federal protections for collective bargaining in 1935. Keeping those protections on paper has not preserved workers’ power to use them.
Pay reflects the power to negotiate. When workers have few alternatives, or changing jobs is costly, employers gain room to hold wages down. A labor market with weak bargaining power rewards workers on terms they have little ability to change.
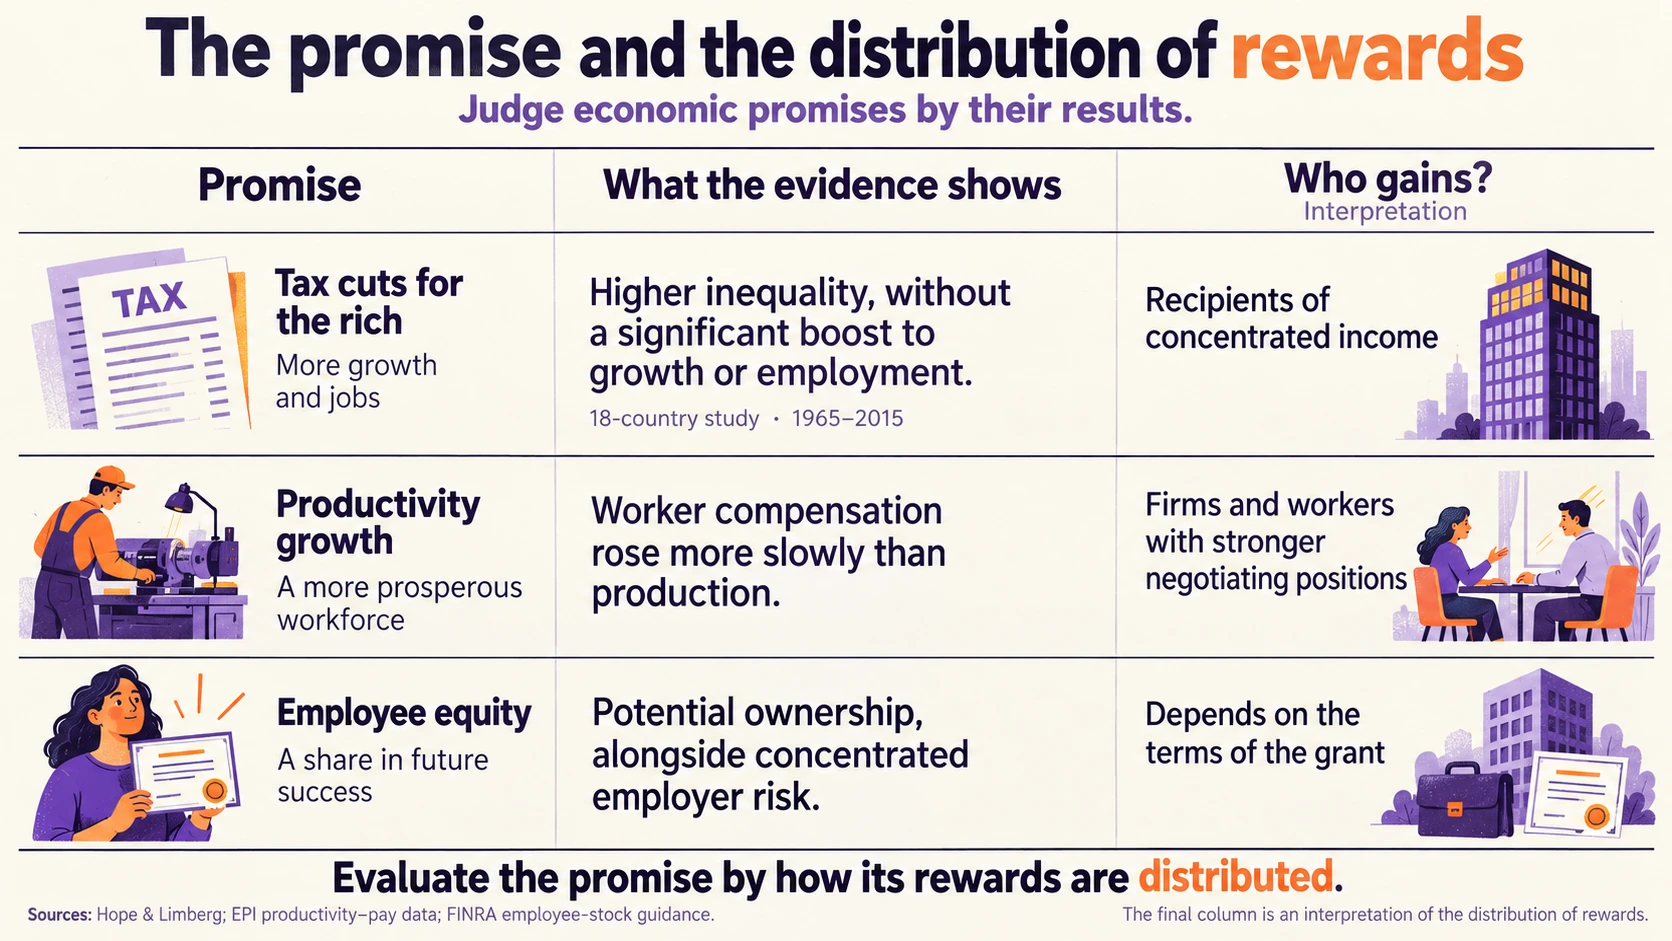
Between late 1979 and late 2024, net productivity rose about 88%. Real hourly compensation for production and nonsupervisory workers rose about 32%. Workers helped produce a much richer economy. Their compensation captured only part of its growth.
Workers became more productive without receiving equivalent compensation growth.
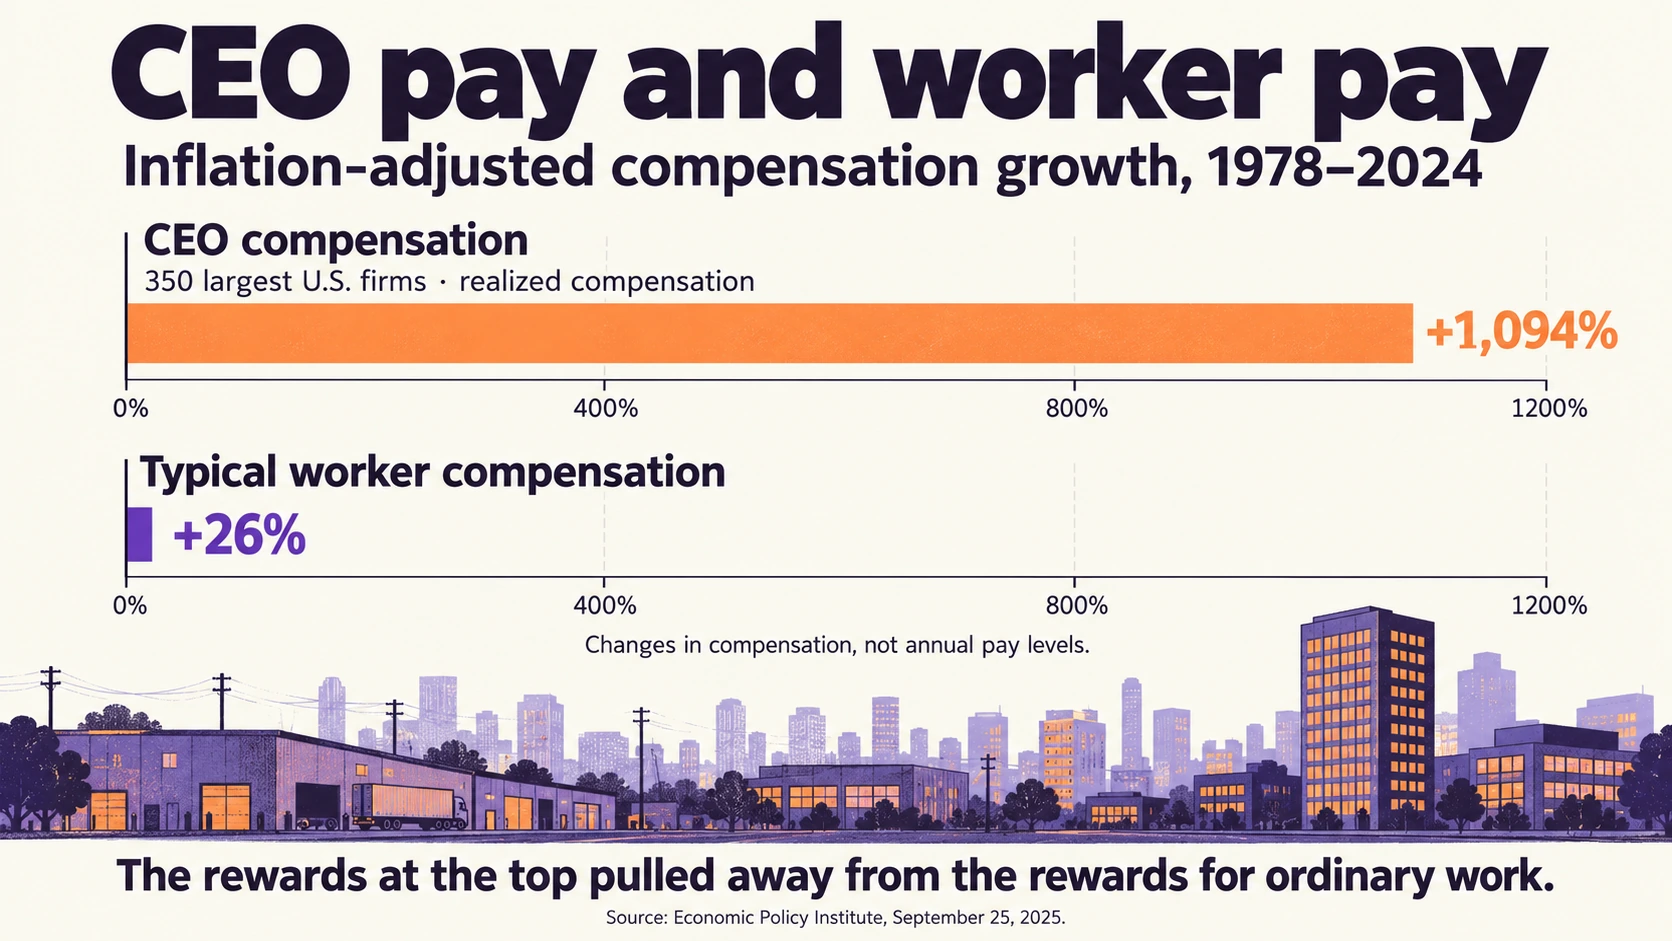
CEOs at the largest firms received 281 times typical worker compensation in 2024. In 1965, the ratio was 21 to one.
From 1978 to 2024, inflation-adjusted CEO compensation grew 1,094%. Typical worker compensation grew 26%.
The rewards at the top pulled away from the rewards for ordinary work.
Those rewards reflect who negotiates them and who influences the rules.
S&P 500 companies spent $942.5 billion buying back their own shares in 2024. Corporate America had enormous sums to distribute to shareholders. How much reached workers depended on decisions about who should benefit from the wealth those businesses produced.
During the financial crisis, the federal government disbursed $443.5 billion through TARP to stabilize the financial system. When that system was threatened, extraordinary public action became possible.
The same urgency should apply to the economic security of the people whose work keeps the country running.
The promise of shared prosperity should be judged by its results. A study of major tax cuts for the rich across 18 advanced economies found higher inequality without a significant boost to growth or employment. The benefits accumulated at the top. The promised gains for everyone else failed to materialize in the study’s results.
The society outside the gates
What worries me most is the damage that follows when people stop believing success is reasonably attainable or fairly earned.
Having lived in Brazil, I am troubled by the possibility of a society in which wealth increasingly purchases insulation from everyone else: walls, guards, armored cars.
Walls, guards, and armored cars turn private wealth into protection from the society outside. They offer a grim picture of what happens when people lose faith in a shared future.

When a wealthy person becomes a symbol of rules that seem inaccessible or unfair, admiration can give way to resentment. Dismissing that reaction as envy avoids examining whether the underlying grievance has merit.
The middle class has an important choice here. It can continue organizing its politics around the wealth it hopes to acquire, or give greater weight to the conditions under which it actually works.
Affluent professionals have reasons to align with the bottom half. They need fair terms at work, affordable essential services, and a broad share of economic growth. Their greater income gives them greater capacity to contribute. It does not erase their interest in a society that offers security to people who work.
Their politics should begin with the conditions they live under today. A hoped-for fortune is a poor basis for deciding whose interests to defend. People earning $500,000 or $1 million do not need to imagine themselves poor to recognize that their future is tied to the treatment of work.
Who owns the future
AI makes those interests more urgent.
One in four jobs worldwide has some exposure to generative AI, according to the ILO and NASK. That puts the distribution of future productivity gains at the center of the argument.
When technology allows people to produce more, who receives the benefit?
Workers could receive higher compensation, shorter hours, or a share of the resulting ownership income. They could also face greater workloads and insecurity while the financial gains accrue elsewhere.
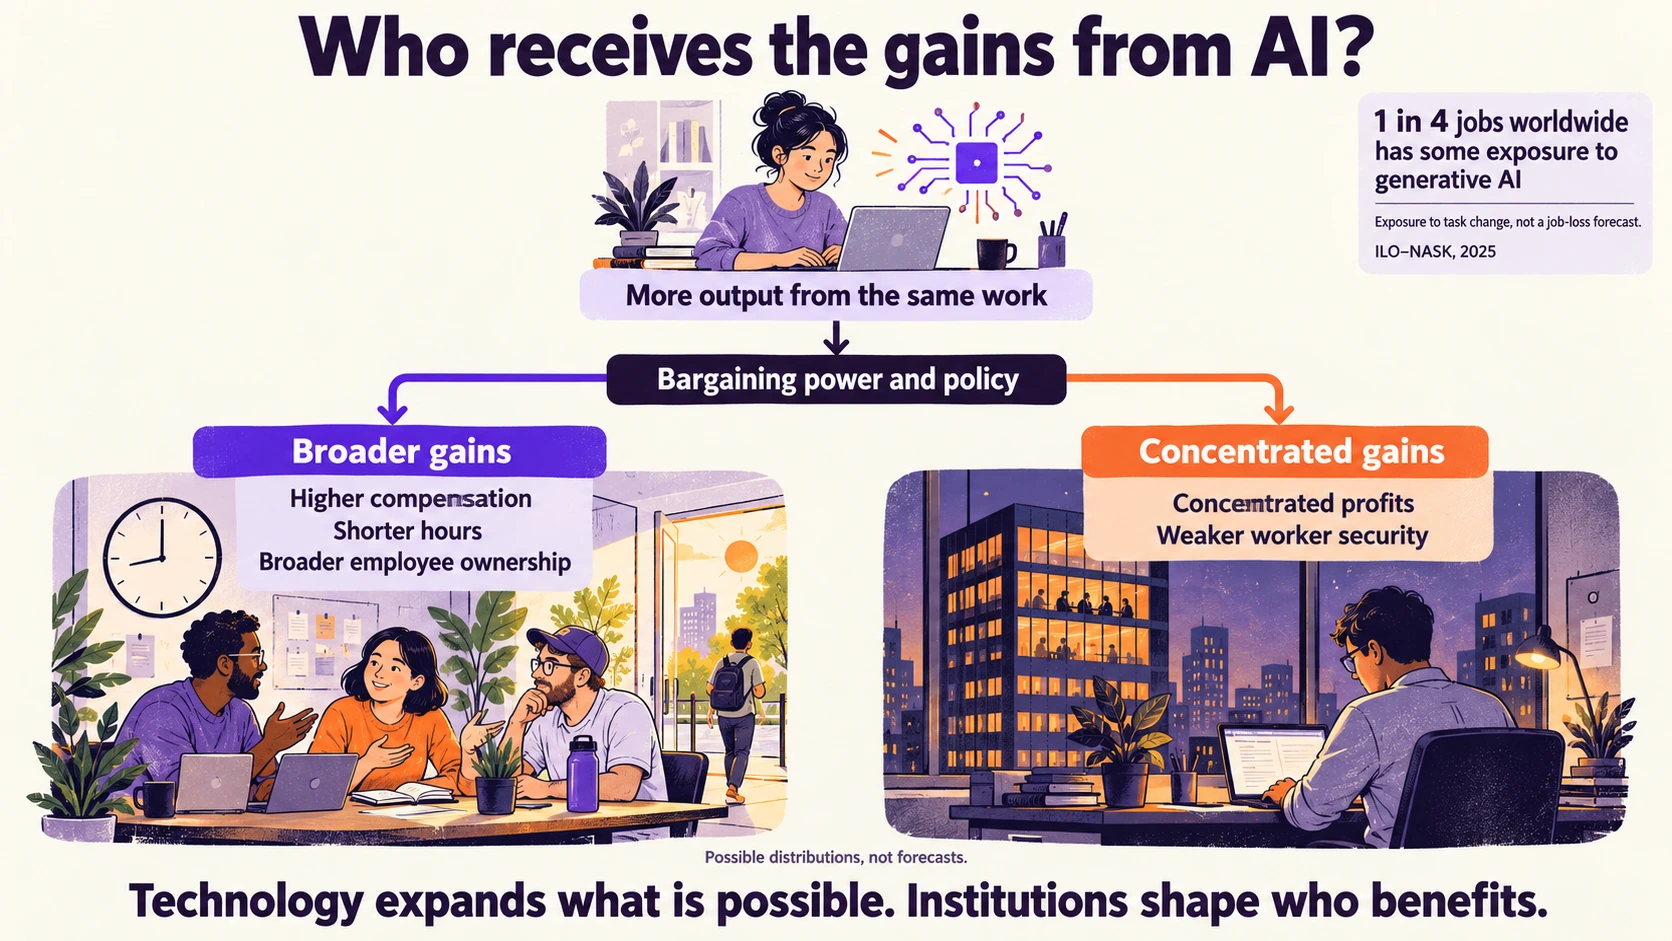
The outcome will depend on the institutions we build.
Strengthen collective bargaining. Give employees a larger share of profits and ownership. Tax concentrated gains to support public services. Build more housing and make healthcare, education, and childcare more affordable. Give workers a voice in how AI changes their jobs.
These are ways to make prosperity more dependable for the people who contribute to it.
I still value the optimism I heard in Fittipaldi’s answer. It helped bring me here.
Preserving that optimism requires giving people sound reasons to believe their effort will improve their lives. We cannot keep asking people to tolerate insecurity because an extraordinary payoff might be waiting.
The American dream should remain ambitious enough to inspire exceptional achievement and practical enough to deliver a secure life to people who never become rich.

Sources
Sources are grouped by topic in the order they appear in the article.
1. Fittipaldi’s racing career
Formula One’s career history · INDYCAR’s account
2. American economic growth
BEA real GDP and real GDP per capita, 1980–2024.
BEA data via FRED: GDP · GDP per capita
3. The policy shift
Reagan’s program · Carter’s signing remarks · Federal Reserve history
4. Expectations of upward mobility
Bénabou and Ok, “Social Mobility and the Demand for Redistribution.”
5. Social mobility
Opportunity Insights compares inflation-adjusted household incomes at age 30; OECD covers intergenerational mobility.
The Fading American Dream · OECD’s review of social mobility
6. Trading apps
Robinhood funded accounts, 2019 and 2021; FINRA survey of investors with nonretirement investments, 2024.
Robinhood’s 2021 annual report · FINRA Foundation’s 2024 investor survey
7. Legal sports betting
2024 wagers and commercial sportsbook revenue.
American Gaming Association, State of the States 2025
8. Robinhood and prediction markets
Pew measures global notional taker volume at $1 per contract; Robinhood reports a count of contracts traded.
Robinhood’s launch announcement · Robinhood’s 2025 results · Pew Research Center, September 2026
9. Startup returns and employee equity
Ghosh’s historical estimate concerns projected investment returns. FINRA covers concentration in employer stock.
Harvard Business School on startup failure · FINRA on employee stock awards and concentration risk
10. Housing costs and emergency savings
Harvard: renters, 2022. Federal Reserve: adults, 2024.
Harvard’s housing research · Federal Reserve, 2024 household survey
11. Income concentration
Census household money income excludes capital gains; IRS adjusted gross income includes realized gains and ranks tax returns excluding dependents.
Census Bureau, Table A-4b · IRS, Table 4.1, tax years 2001–2022
12. Wealth concentration
Federal Reserve Distributional Financial Accounts: 1989 Q3 and 2024 Q4.
Federal Reserve: top 1% · top 0.1% · bottom 50%
13. Bay Area wages
May 2025 hourly means annualized at 2,080 hours: $100,235 and $119,226 per worker.
BLS, San Francisco metro wages · BLS, San Jose metro wages
14. The highest income percentiles
IRS Table 4.1, 2023: top 1% AGI floor $675,602. Top 0.01% mean: $719,995 million divided by 15,308 returns = $47.03 million.
IRS income percentile data, Table 4.1
15. CEO and worker compensation
EPI’s September 25, 2025 release: 2024 realized CEO compensation $22.98 million; 281-to-1 pay ratio; 1978–2024 real growth of 1,094% versus 26%.
EPI’s 2024 CEO compensation estimate
16. Collective bargaining
BLS union membership, 1983 and 2024; NLRB history of the Wagner Act.
Bureau of Labor Statistics · NLRB history of the Wagner Act
17. Employer bargaining power
Treasury, The State of Labor Market Competition
18. Productivity and compensation
EPI indexed series, 1979 Q4–2024 Q4; compensation includes benefits.
19. Share buybacks
S&P 500 buybacks in 2024.
20. TARP
Treasury reports $443.5 billion disbursed and an estimated lifetime net cost of $31.1 billion.
21. Tax cuts and shared prosperity
Hope and Limberg, “The economic consequences of major tax cuts for the rich.”
22. Generative AI and work
ILO–NASK global index, 2025; measures occupational exposure to task transformation.